
In the first part of this series of articles, Dr Bill Eccles from Bolt Science Ltd looks at the probability of bolt and joint failure – even in instances where the preload value and the preload requirement are the same.
The root cause for the majority of bolt or joint failures is due to insufficient preload. It is unusual for the bolt to be overloaded – but if the preload provided by the bolt is insufficient, joint separation and movement can occur resulting in possible bolt fatigue and self-loosening issues.
In order to ensure that such problems do not occur it is vital that there is sufficient residual clamp force acting on the joint interface after accounting for the effects of the applied forces and embedding losses. A preload requirement chart (Figure One) graphically illustrates this point as it looks at the forces acting on the joint interface.
I was recently asked the question that if the minimum preload value was equal to the total preload requirement, meaning the design margin would be 1, would the joint be okay. Most engineers are familiar with the use of a design margin or factor of safety. Crudely put, if the margin is below 1 the joint will fail, if above 1 it will be okay – it gives that certainty which we crave.
Instead of being absolute values, preload, applied forces, embedding loss and other metrics are probability distributions. 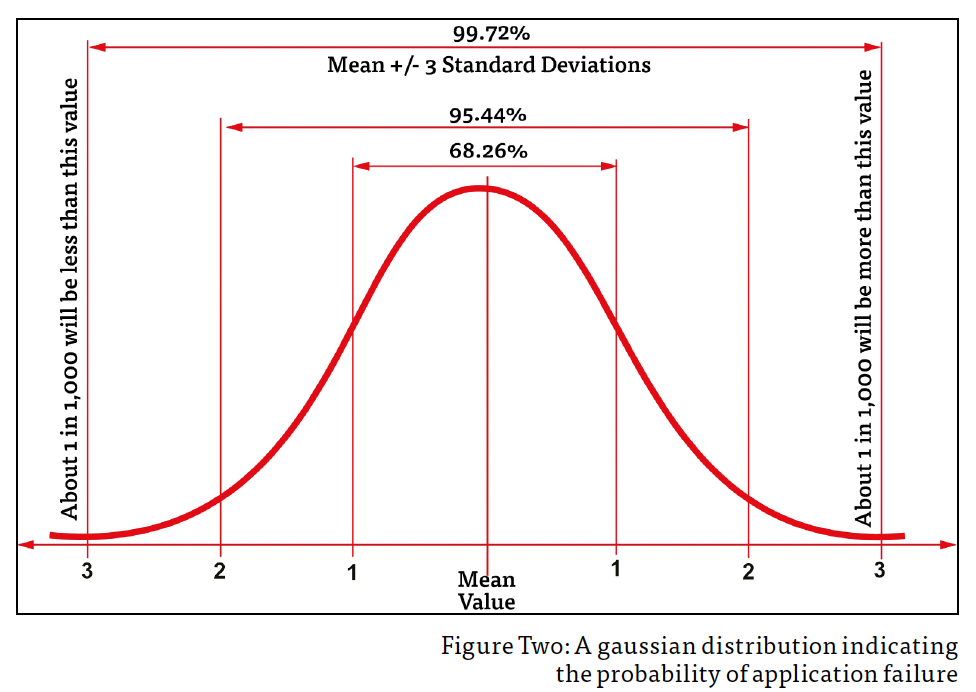 This means that the answer to the question that if the design margin was 1, would everything be okay, cannot be categorical. There will be a probability, a small one, that the total preload requirement would be greater than the minimum preload. Hence, not okay.
A truer picture is what probability of failure is acceptable. This is likely to vary with the application, no one is likely to be happy if a nuclear reactor joint had a failure probability of 1 in 1,000. A normal, or gaussian, distribution is the famous bell-shaped curve that is shown in Figure Two. The results centre around the mean, and away from this the values become less and less likely.
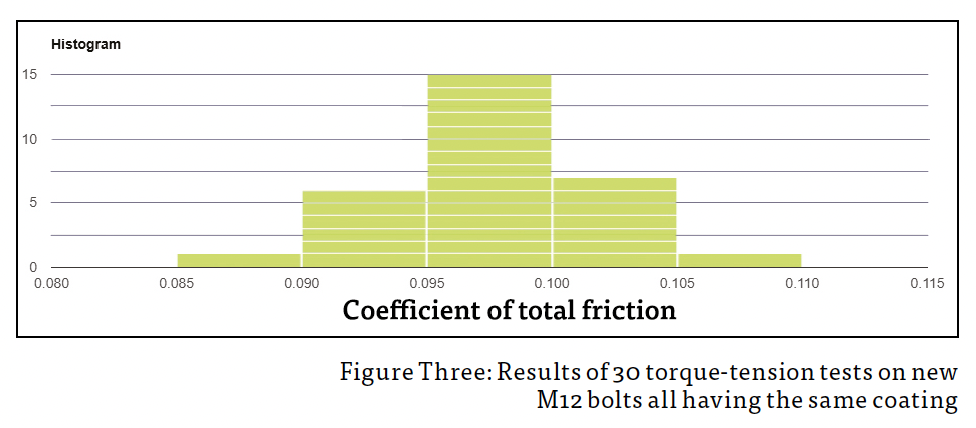
Based upon the analysis of many torque-tension tests, as well as torque measurement, the distributions are normal, or usually close to normal. A typical set of results is shown in Figure Three.
 Normally, given the uncertainty about the loading and preload values, engineering judgement would be used to decide what design margin would be acceptable. But just based upon the statistical aspect, if the design margin was just 1, there is a chance that in practice a very low failure rate can be expected assuming that load and preload values are known. To get a failure rate that was insignificant, the design margin needs to be larger than 1. A probability assessment can be used, together with some engineering judgement, to determine how much larger than 1 the design margin needs to be given the implications if failure of the application did occur.
The aspect of statistical analysis of bolted joints will be discussed further in part 2.


Becca is the latest member to join our team and is eager to get stuck into the world of fasteners. She brings an enthusiastic and fresh outlook on what we do editorially and will be leading our social media activity – including sourcing material, editing articles and posting online.

